Fantom Has Broken the Support: What Is the Next Target?
Fantom is a network of blockchain that allows users to build their blockchain system for scalability, effectiveness, and speed. It is a layer 1 blockchain network that offers many functions to DeFi users. Besides trading, it also allows you to borrow digital assets, stake, lend, mint, and much more.
It was founded by Dr. Byung Ik- a South Korean scientist, but the current CEO is Michael Kong. The team consists of dedicated developers and computer scientists who upgrade the blockchain and DeFi ecosystem.
It uses an aBFT (Asynchronous Byzantine Fault Tolerance) algorithm to detect acyclic graph consensus. It ensures transactions are fair and secure. It also addresses issues related to speed and scalability and eliminates dependency on timing because it makes the confirmation process faster than traditional blockchains.
It has already partnered with many universities to work and develop FVM (Fantom Virtual Machine), which is similar to EVM. Still, they will add unique features to make the machine popular.

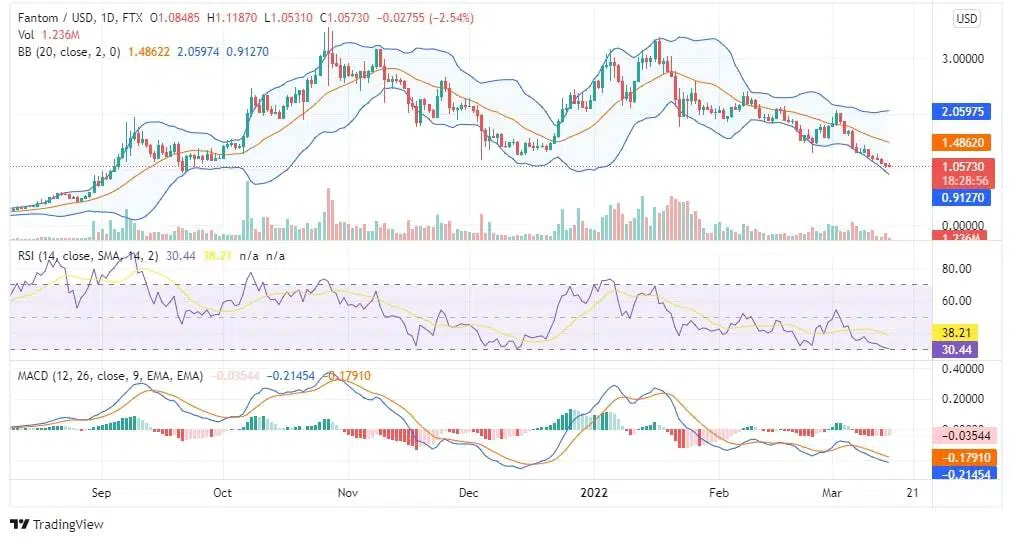
At the time of writing this post, FTM was trading around $1.05, which is around the support level of $1.10. In the last couple of days, it has broken the previous support level of $1.40. It means it is very bearish in the short term. Moreover, all technical indicators support this view.
On the daily chart, MACD is bearish, the RSI is below 40, and red candlesticks are forming in the lower half of the Bollinger Band. The volume is also decreasing, so as per Fantom price prediction, it is not the right time for short-term investment.
In the last four months, it has consolidated in a range of $2.30 to $1.50; if it goes back to the level, it can be a good time for short-term investment.

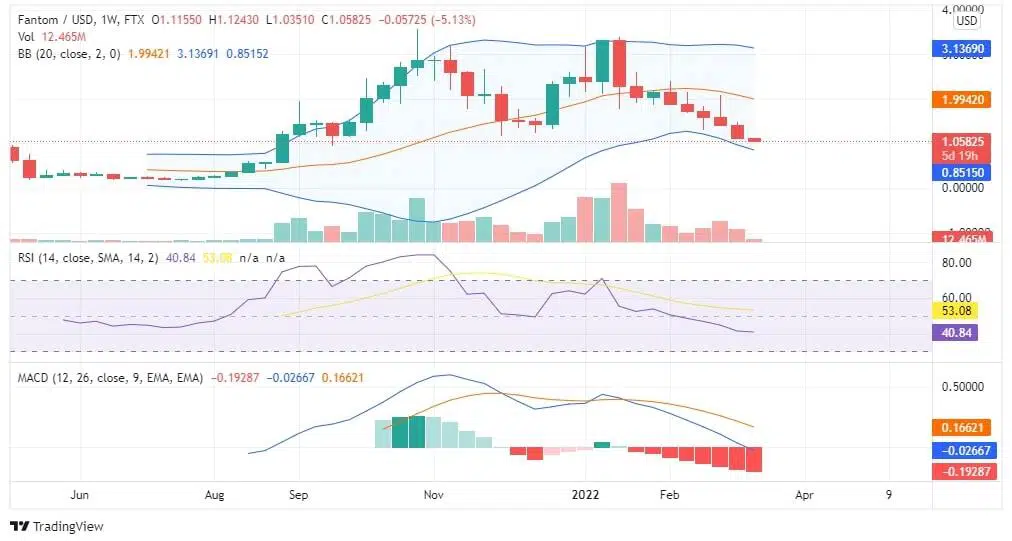
On the weekly chart, we can find a high of $3.36, and after that, it has been in a downtrend. The MACD is bearish with seven red histograms, and Bollinger Band also suggests six red candlesticks have formed in the lower half.
We cannot mark any support level on this chart, so it is also bearish from the long-term point of view. The same has been indicated by the technical indicators also.
We would not recommend you to invest in this coin until it shows bullish momentum. We think you should wait for a couple of months to get the best opportunity. You should invest when it crosses the $1.50 level, and the long-term target should be higher than the previous high.